
Digital Twin of the Computer & Information Sciences Building at Northumbria University to improve indoor Air Quality
About the project
While CO2 monitoring, as a part of BMS operations, has been widely spreading, it is only largely used for the purpose of saving energy and reducing costs rather than as a tool for improving public health. With people spending almost 90% of their time inside buildings, research indicates how influencing indoor air quality can be on humans occupying indoor space. This involves impacts on the level of comfort, mental performance, health, and general well-being. Alternatively, studies have shown that good indoor air quality can raise people’s productivity by up to 10%. Moreover, the spread of the COVID-19 pandemic has made the issue of poor indoor air quality a critical and urgent matter, whereas inadequate ventilation may increase the risk of transmission.
To overcome these issues, this project aimed at developing a digital twin of Computer and Information Sciences building [BLD] that can support decision making pertaining to improving indoor air quality. For this project, the “Twinview” platform was used to host and communicate the collected datasets. The BIM model of BLD, the CO2 sensors data, and the footfall sensors data were all uploaded to Twinview. Consequently, data analyses and visualisation were conducted using Python and Excel. The results offered insights into what events are most influential or have the greatest impact on indoor air quality and indoor CO2 levels. Therefore, the DT informed decision makers to implement a proactive, long-term, and sustainable solution to indoor air quality [IAQ] problems by revising the schedules and location of events held at BLD, instead of the reactive conventional unsustainable solutions relying on mechanical ventilation to improve IAQ.
The Challenge
While CO2 monitoring, as a part of BMS operations, has been widely spreading, it is only largely used for the purpose of saving energy and reducing costs rather than as a tool for improving public health. With people spending almost 90% of their time inside buildings, research indicates how influencing indoor air quality can be on humans occupying indoor space. This involves impacts on the level of comfort, mental performance, health, and general well-being. Alternatively, studies have shown that good indoor air quality can raise people’s productivity by up to 10%.
Recently, a growing body of research argues that people need to not be exposed to extremely high concentrations of carbon dioxide (CO2) – at least 5,000 ppm – to have health issues. However, low levels such as 1,000 ppm are sufficient to cause health problems if only the exposure lasted for a few hours. Evidence about potential health risks as a result of chronic exposure to relatively higher CO2 levels may include inflammation, reductions in higher-level cognitive abilities, bone demineralisation, kidney calcification, oxidative stress, and endothelial dysfunction. Moreover, the spread o COVID-19 pandemic has made the issue of poor indoor air quality a critical and urgent matter, whereas inadequate ventilation may increase the risk of transmission.
The Solution
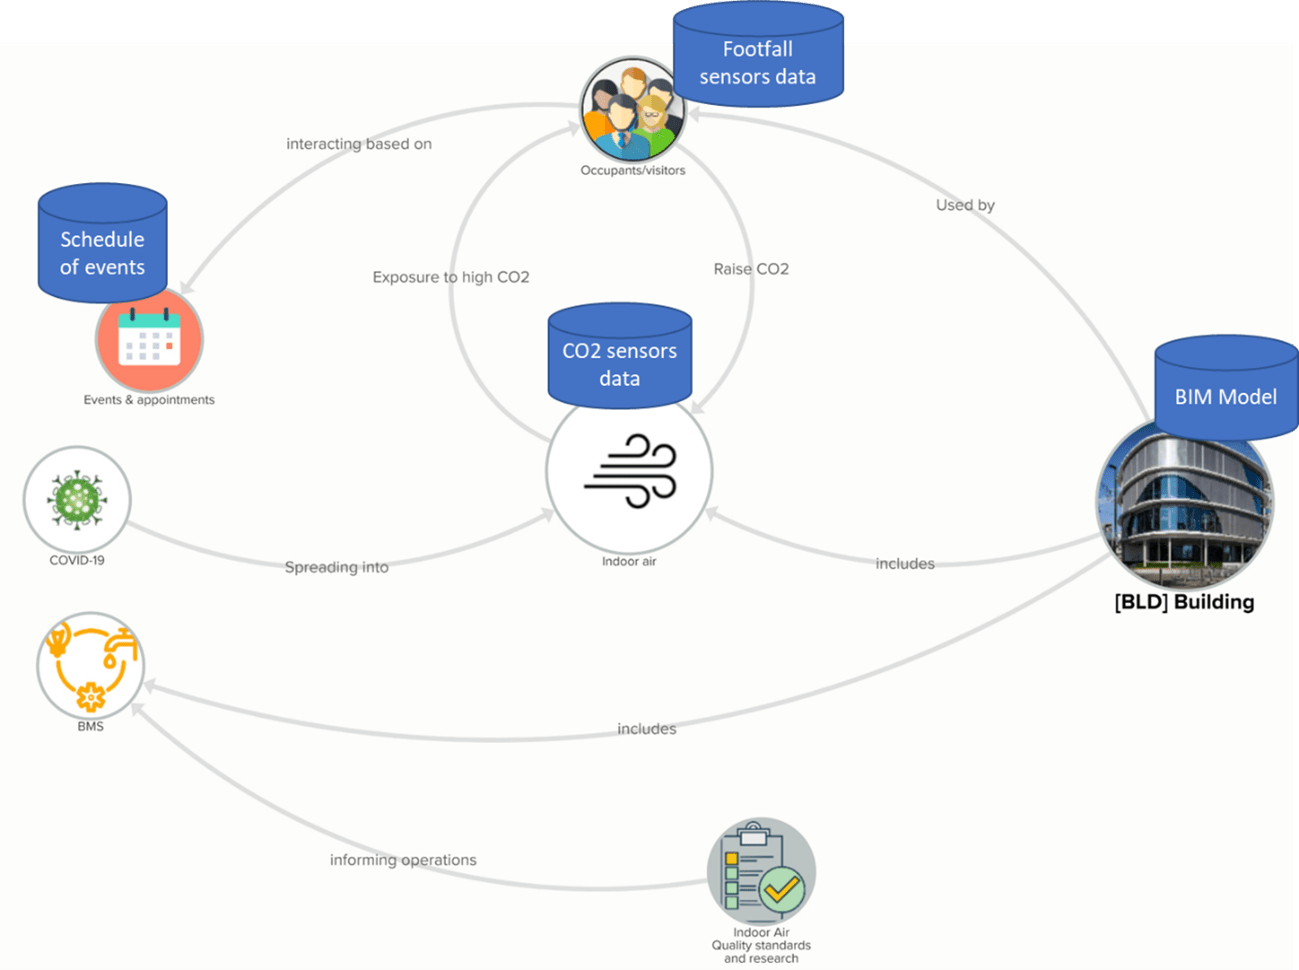
To fully appreciate the phenomenon being studied, it is required to perceive the bigger picture. and delineate a holistic boundary of the problem under study in conjunction with key stakeholders. For our problem – indoor air quality at CIS building [BLD] – a one-hour workshop was conducted, involving all project team members. The aim of the workshop was to fully appreciate the situation, identify the key structures influencing the phenomenon of indoor air quality and the relevant datasets that need to be captured. To adequately capture the richness of a complex problem, it was useful to draw on systems thinking methods and techniques. One of the effective tools used by systems thinkers to make sense of messy situations is “rich pictures”. The figure shows the final version of the rich picture developed in the workshop.
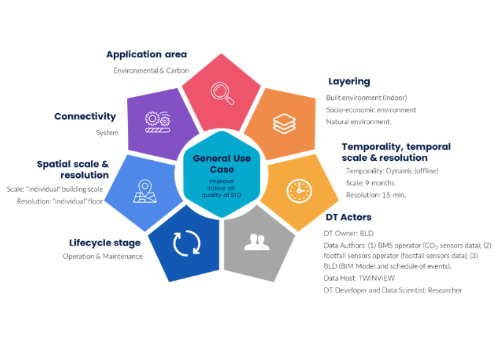
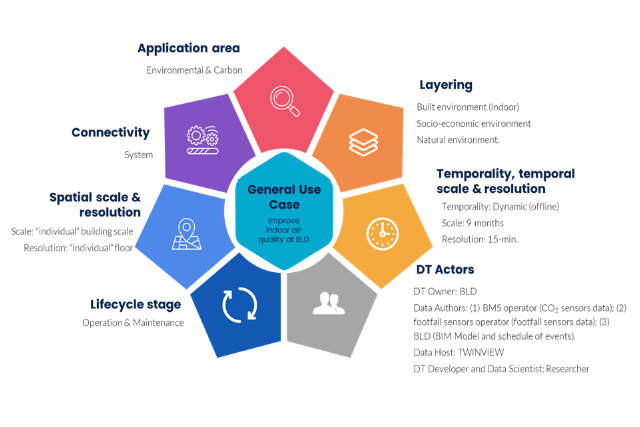
A 7-dimensional framework is employed to specify the different technical features and characteristics of the DT needs to have to deliver the purpose for which it is built (figure).
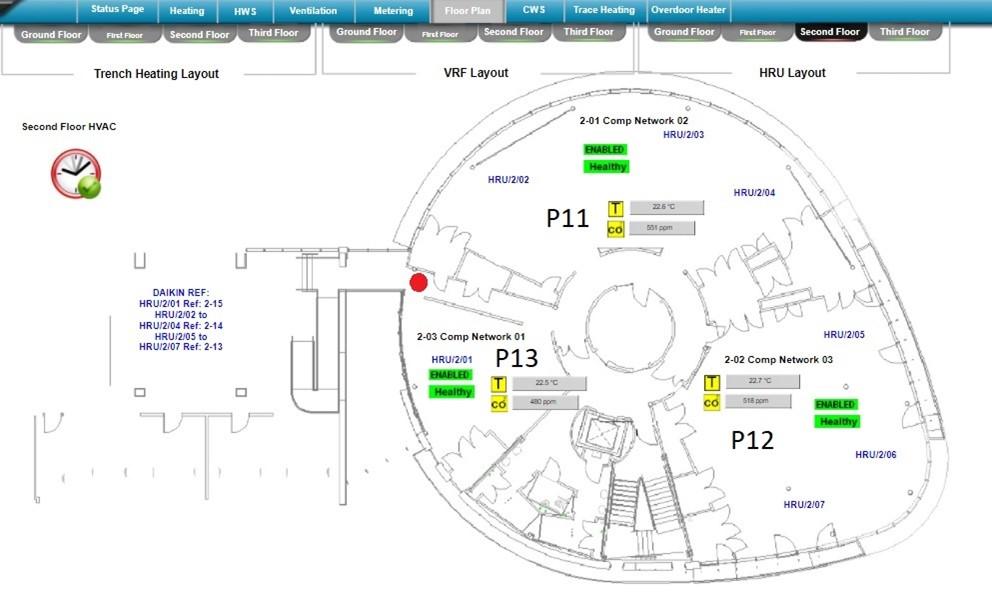
The datasets required for the project were collected. First, the static BIM model of BLD – including as-built architectural and MEP models – is retrieved in ‘Revit’ project file format (.rvt.). Likewise, the CO2 levels and the number of visitors at the 1st and 2nd floors (the ones hosting the vast majority of CIS users’ activities and interactions) were monitored via BMS (Figure below) and quantified using footfall sensors data, respectively. The historical sensors data were collected for a total of 9 months, from the 1st of January 2021 to the 30th of September 2021, at a 15-minutes temporal resolution. Moreover, schedule of key events held at BLD, including summer activities, was also collected in ‘.CSV’ format.
For this project, the “Twinview” platform was used to host and communicate the collected datasets. First, the BIM model, the CO2 sensors data, and the footfall sensors data were uploaded to Twinview. This allowed for visualizing the levels of CO2 and footfall at different spatial locations over a specified period of time. By virtue of the communication capabilities of DT and the Twinview platform, it was easier to familiarise oneself with the nature and patterns of the observed dynamic phenomena.
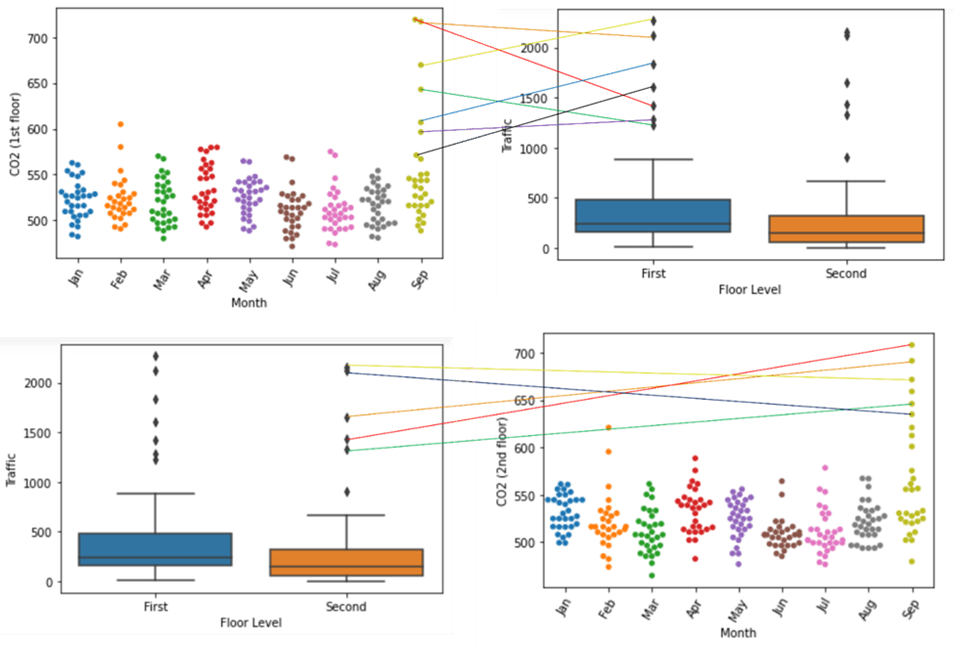
It was obvious that the average monthly CO2 levels at both floors ranged from 500 to 540 ppm, except in September 2021 which witnessed a noticeable rise, up to 553 and 566 ppm in the first and second floors, respectively (figure below). Subsequently, a boxplot chart was created using Python to communicate the daily footfall quantified at both floors over the studied 9 months (figure below).
the exact dates on which footfall outliers were identified, and the corresponding CO2 levels recorded on the same days were inquired. For the first floor, the seven days on which the top seven footfall outliers occurred were the same days during which the highest seven CO2 daily peaks were recorded, albeit not in the same order. Similarly, five of the top six CO2 daily peaks were recorded on the same five days on which the highest traffic turned up. This indicates a strong correlation between number of visitors and CO2 levels. Consequently, it was realized that the week of 20th – 24th September 2021 – the hot week within which the traffic outliers and highest CO2 levels were recorded – is when the “induction week” event took place.
The Impact
In this project, a DT is developed which informed decision makers to implement a proactive, long-term and sustainable solution to indoor air quality [IAQ] problems by revising the schedules and location of events held at CIS building [BLD], instead of the reactive conventional unsustainable solutions relying on mechanical ventilation to improve IAQ.
Next steps, and future opportunities
Showcasing this project has already attracted new opportunities including new DT projects currently in progress.
Further steps are planned to involve applying the same approach to other buildings within Northumbria’s campus including Sutherland building and IC3’s extension to Ellison Terrace.
External Partners: Space Group (TwinView)
Research Dates: September – December 2021
Lead Academic on This Project

Assistant Professor
Department: Computer and Information Sciences

Assistant Professor
Department: Computer and Information Sciences
Assistant Professor
Department: Architecture and Built Environment
Other Academics' Involved
Ramy Elsehrawy
Useful links

Get in Touch
Get involved with IC3. Contact us or Sign-up to our Newsletter at the bottom of the page.